Shiny apps - Molecular Cytology / LCAM
Introduction
On this page you will find the links (just click on the image) for a number of web-based #DataViz tools (Shiny apps) with a short description. More information on the purpose of the app can be found in the "about" tab after running the tool. Some more information can be found at the bottom of this page. If you'd like to have more flexibility this online resource with "DataViz Protocols" may be of interest.
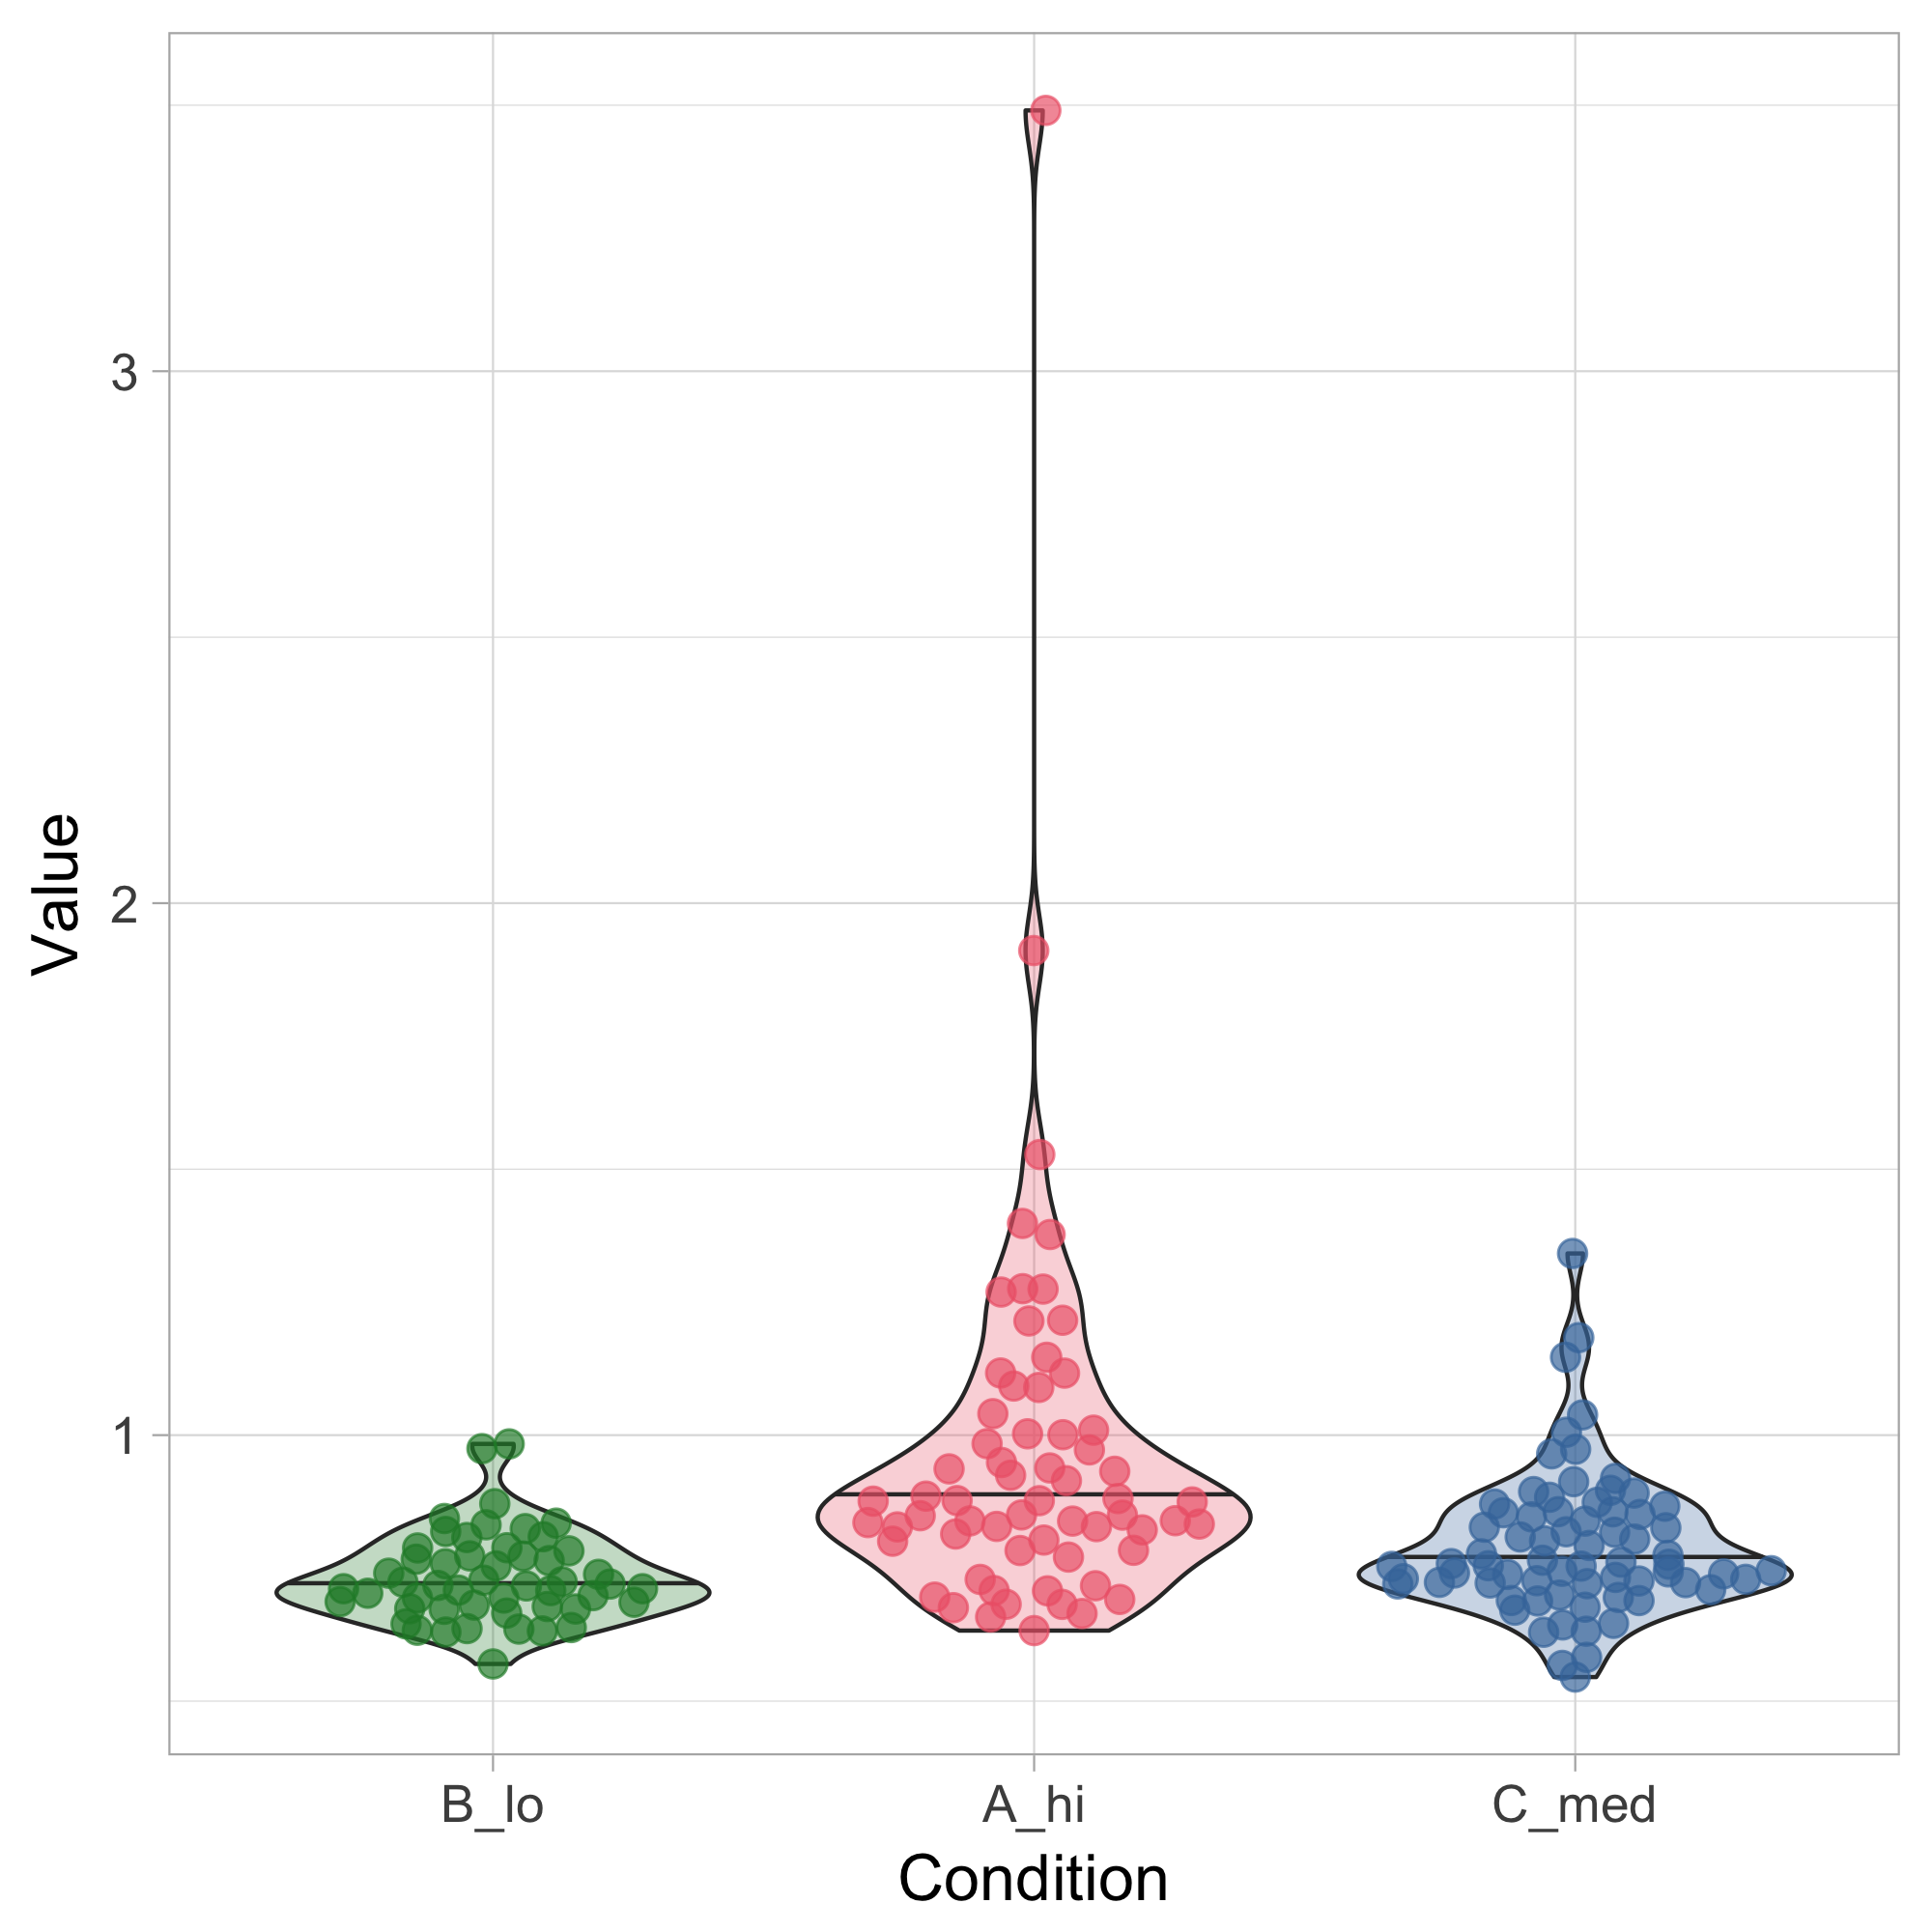
PlotsOfData visualizes (unpaired) data for different conditions together with a choice of statistical summaries. Also, a customizable output table with statistics is generated. The importance of depicting the actual data (instead of summaries only) is discussed in this blog
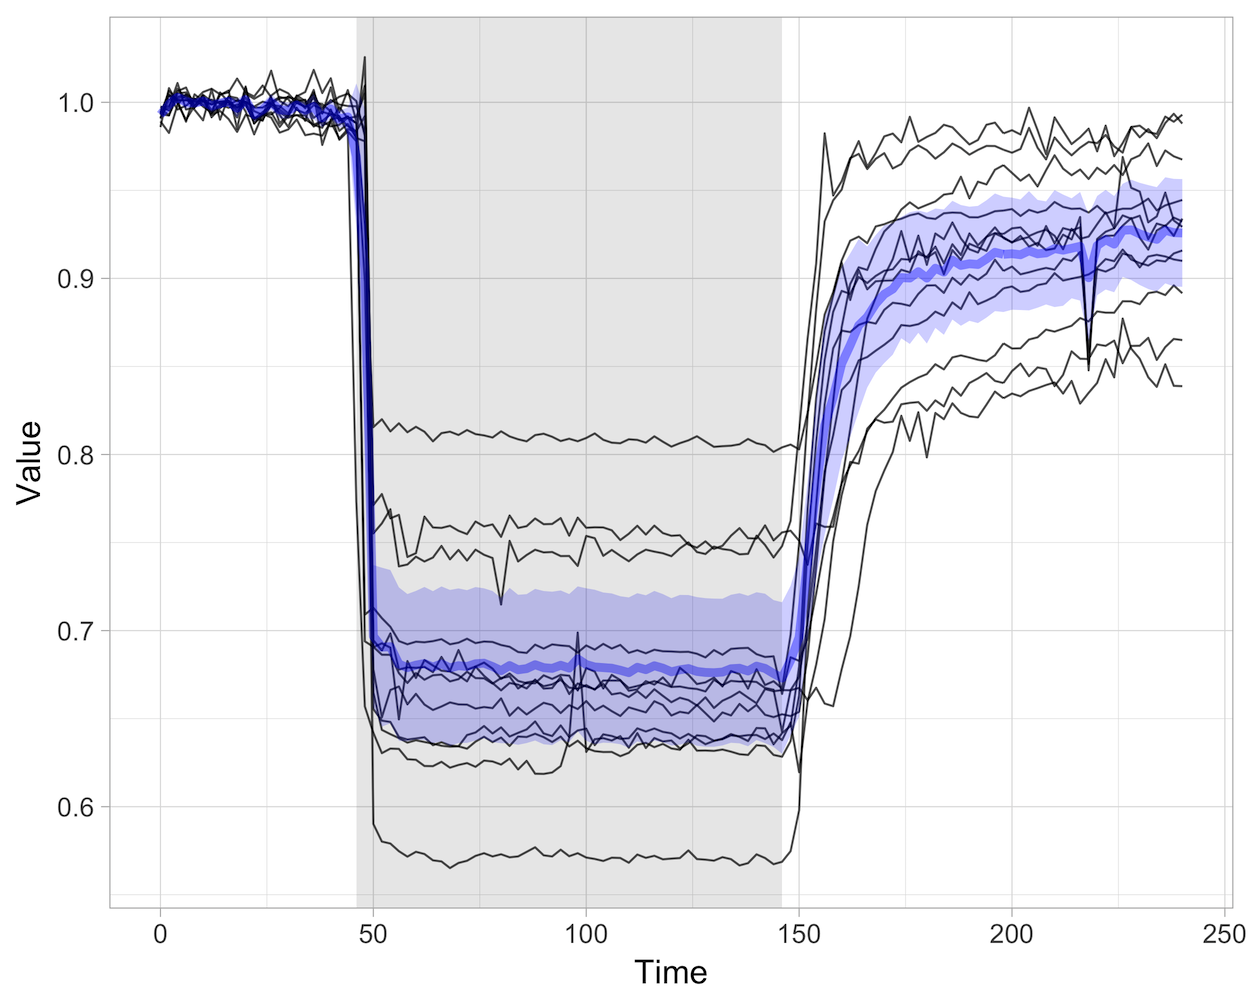
PlotTwist was developed for visualizing data from time-lapse imaging but can be used for any type of continuous data. It features several visualizations, including the small multiple and heatmap. See also this blog
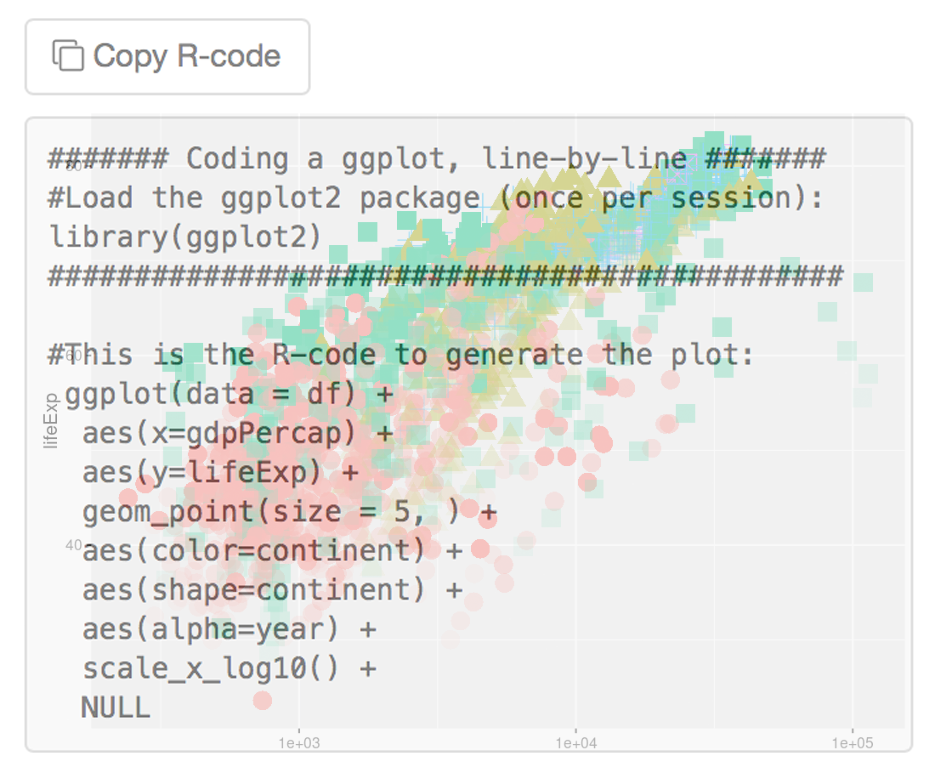
ggPlotteR was developed to demonstrate how ggplot2 can be used to encode a data visualization, line-by-line. After generating the plot, the R-code can be retrieved and directly used in R to (re-)create the plot.
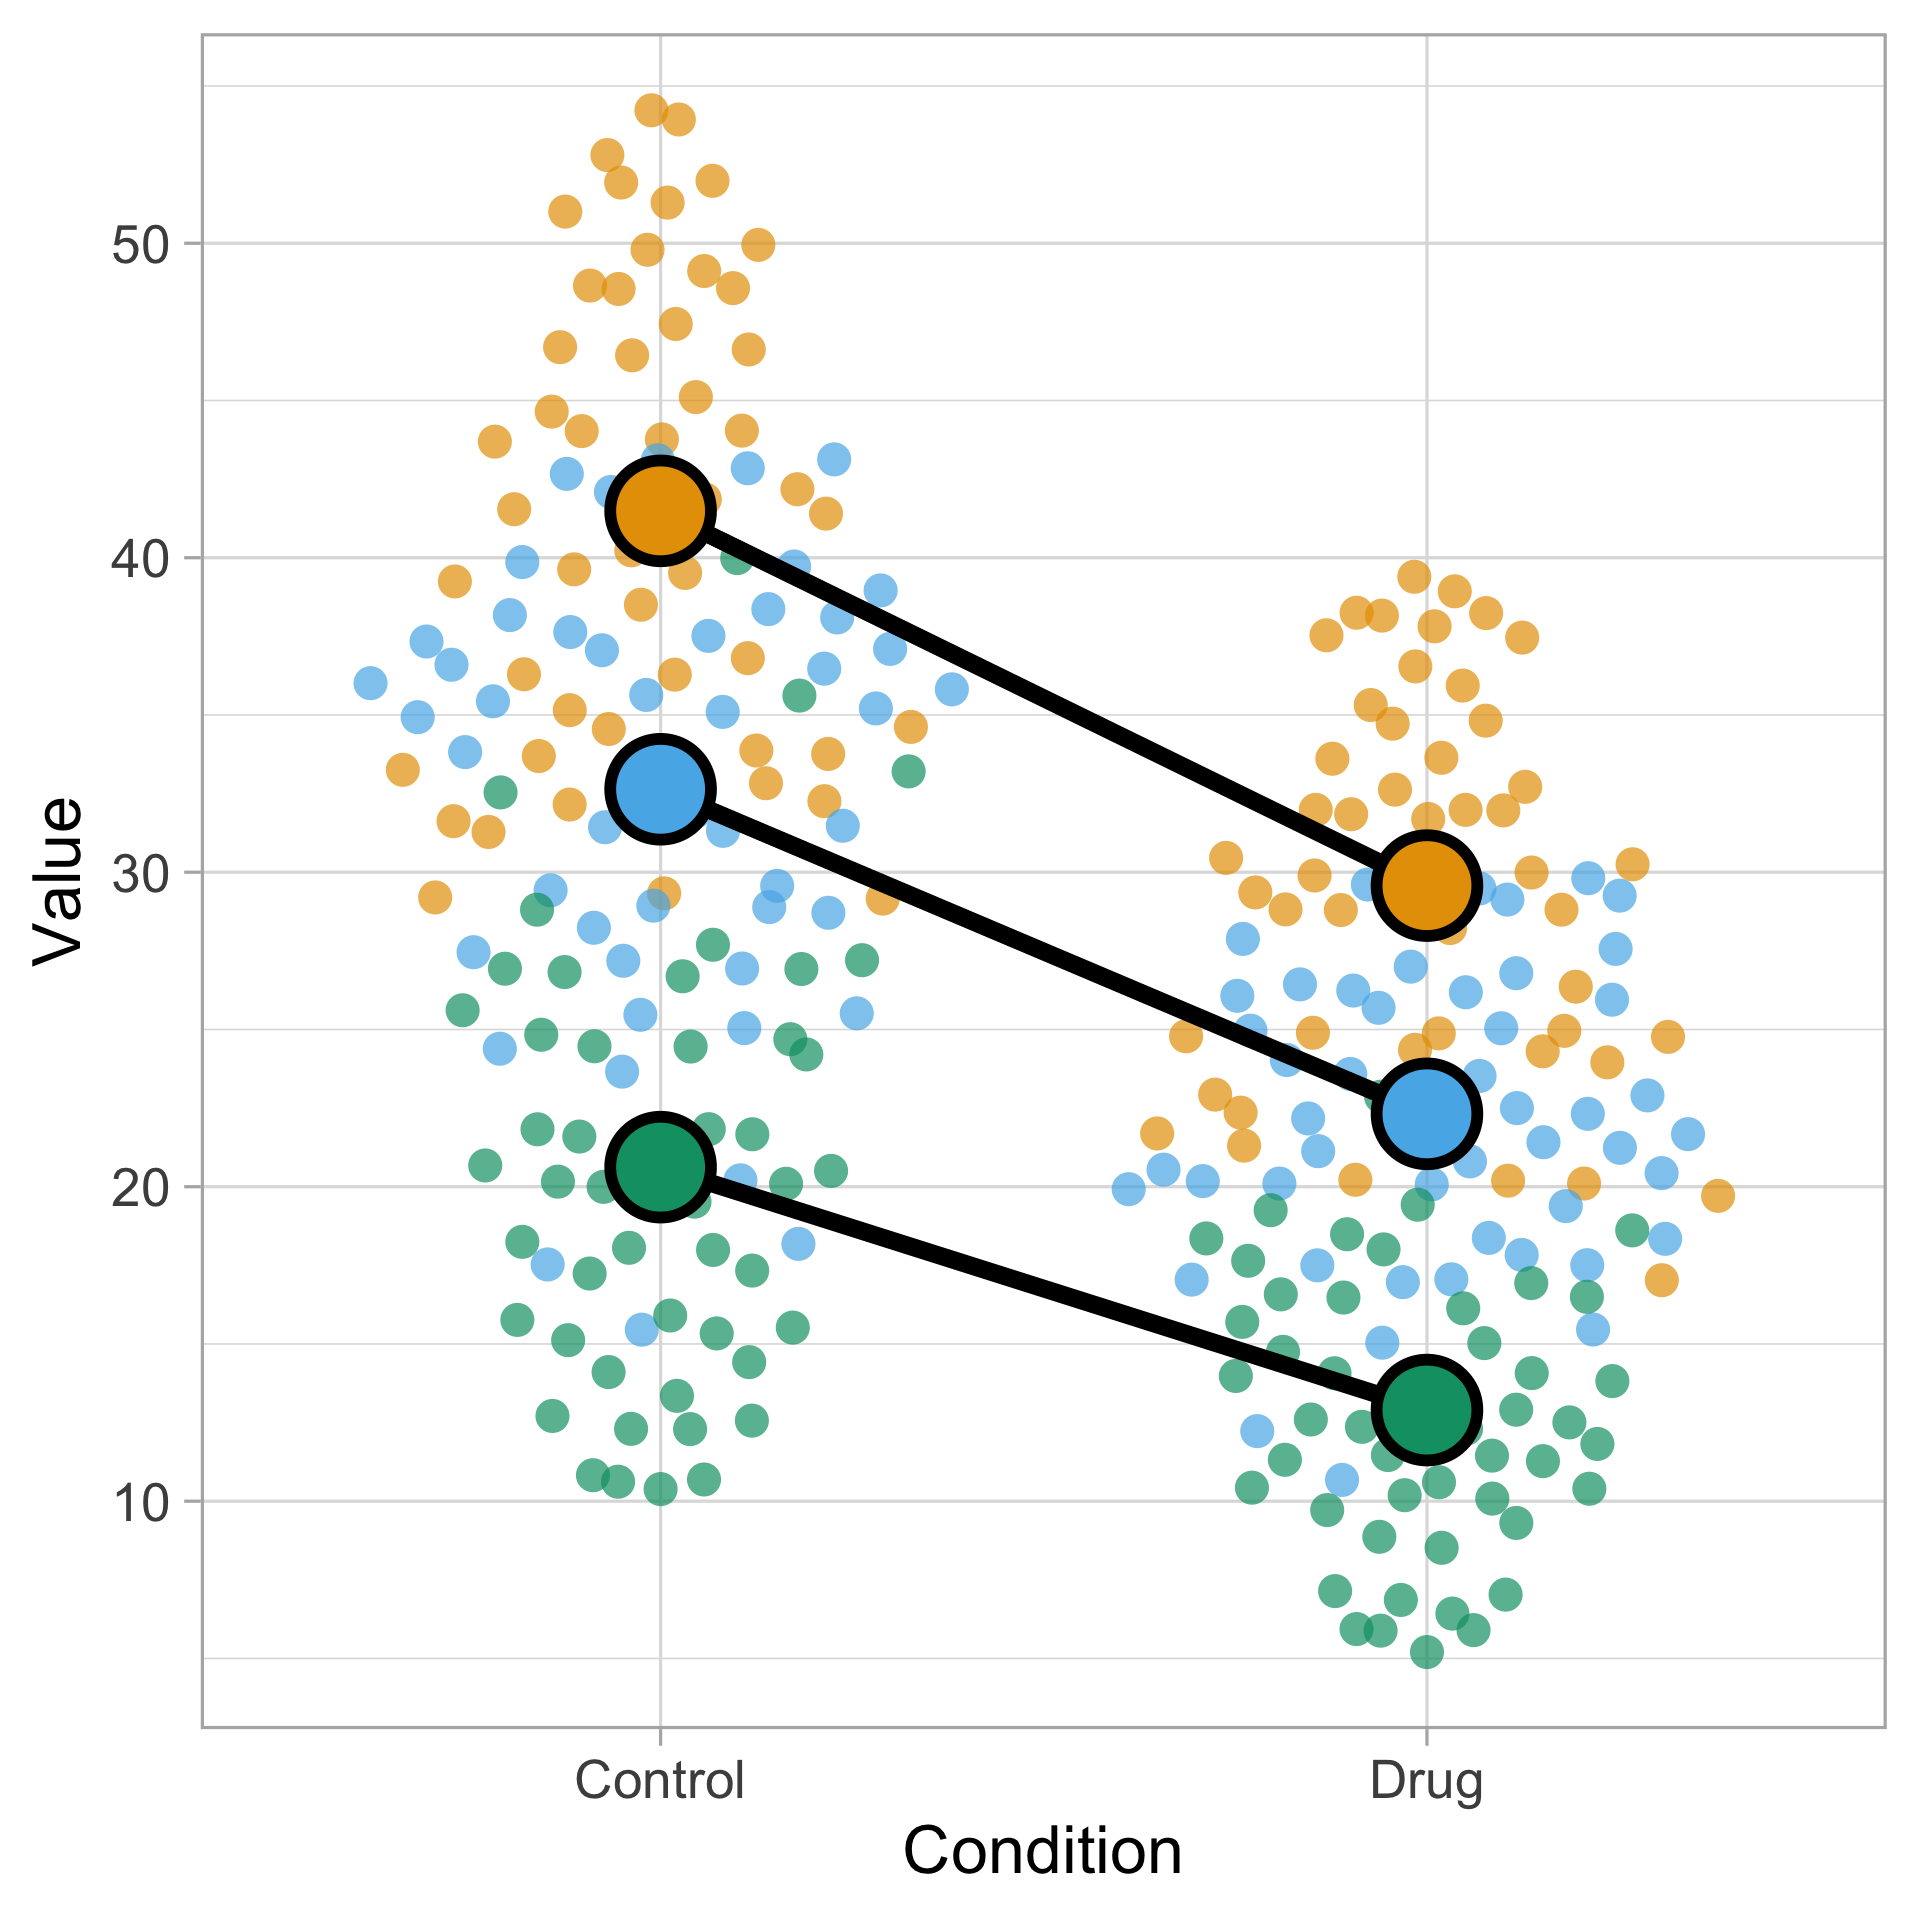
SuperPlotsOfData is an extension of PlotsOfData that enables the identification data from replicate experiments and their analysis. The summary data from the replicates is used for the quantitative comparison of conditions. The difference to a reference is calculated to give an 'effect size', which has advantages over null-hypothesis tests for comparison of samples, see this blog
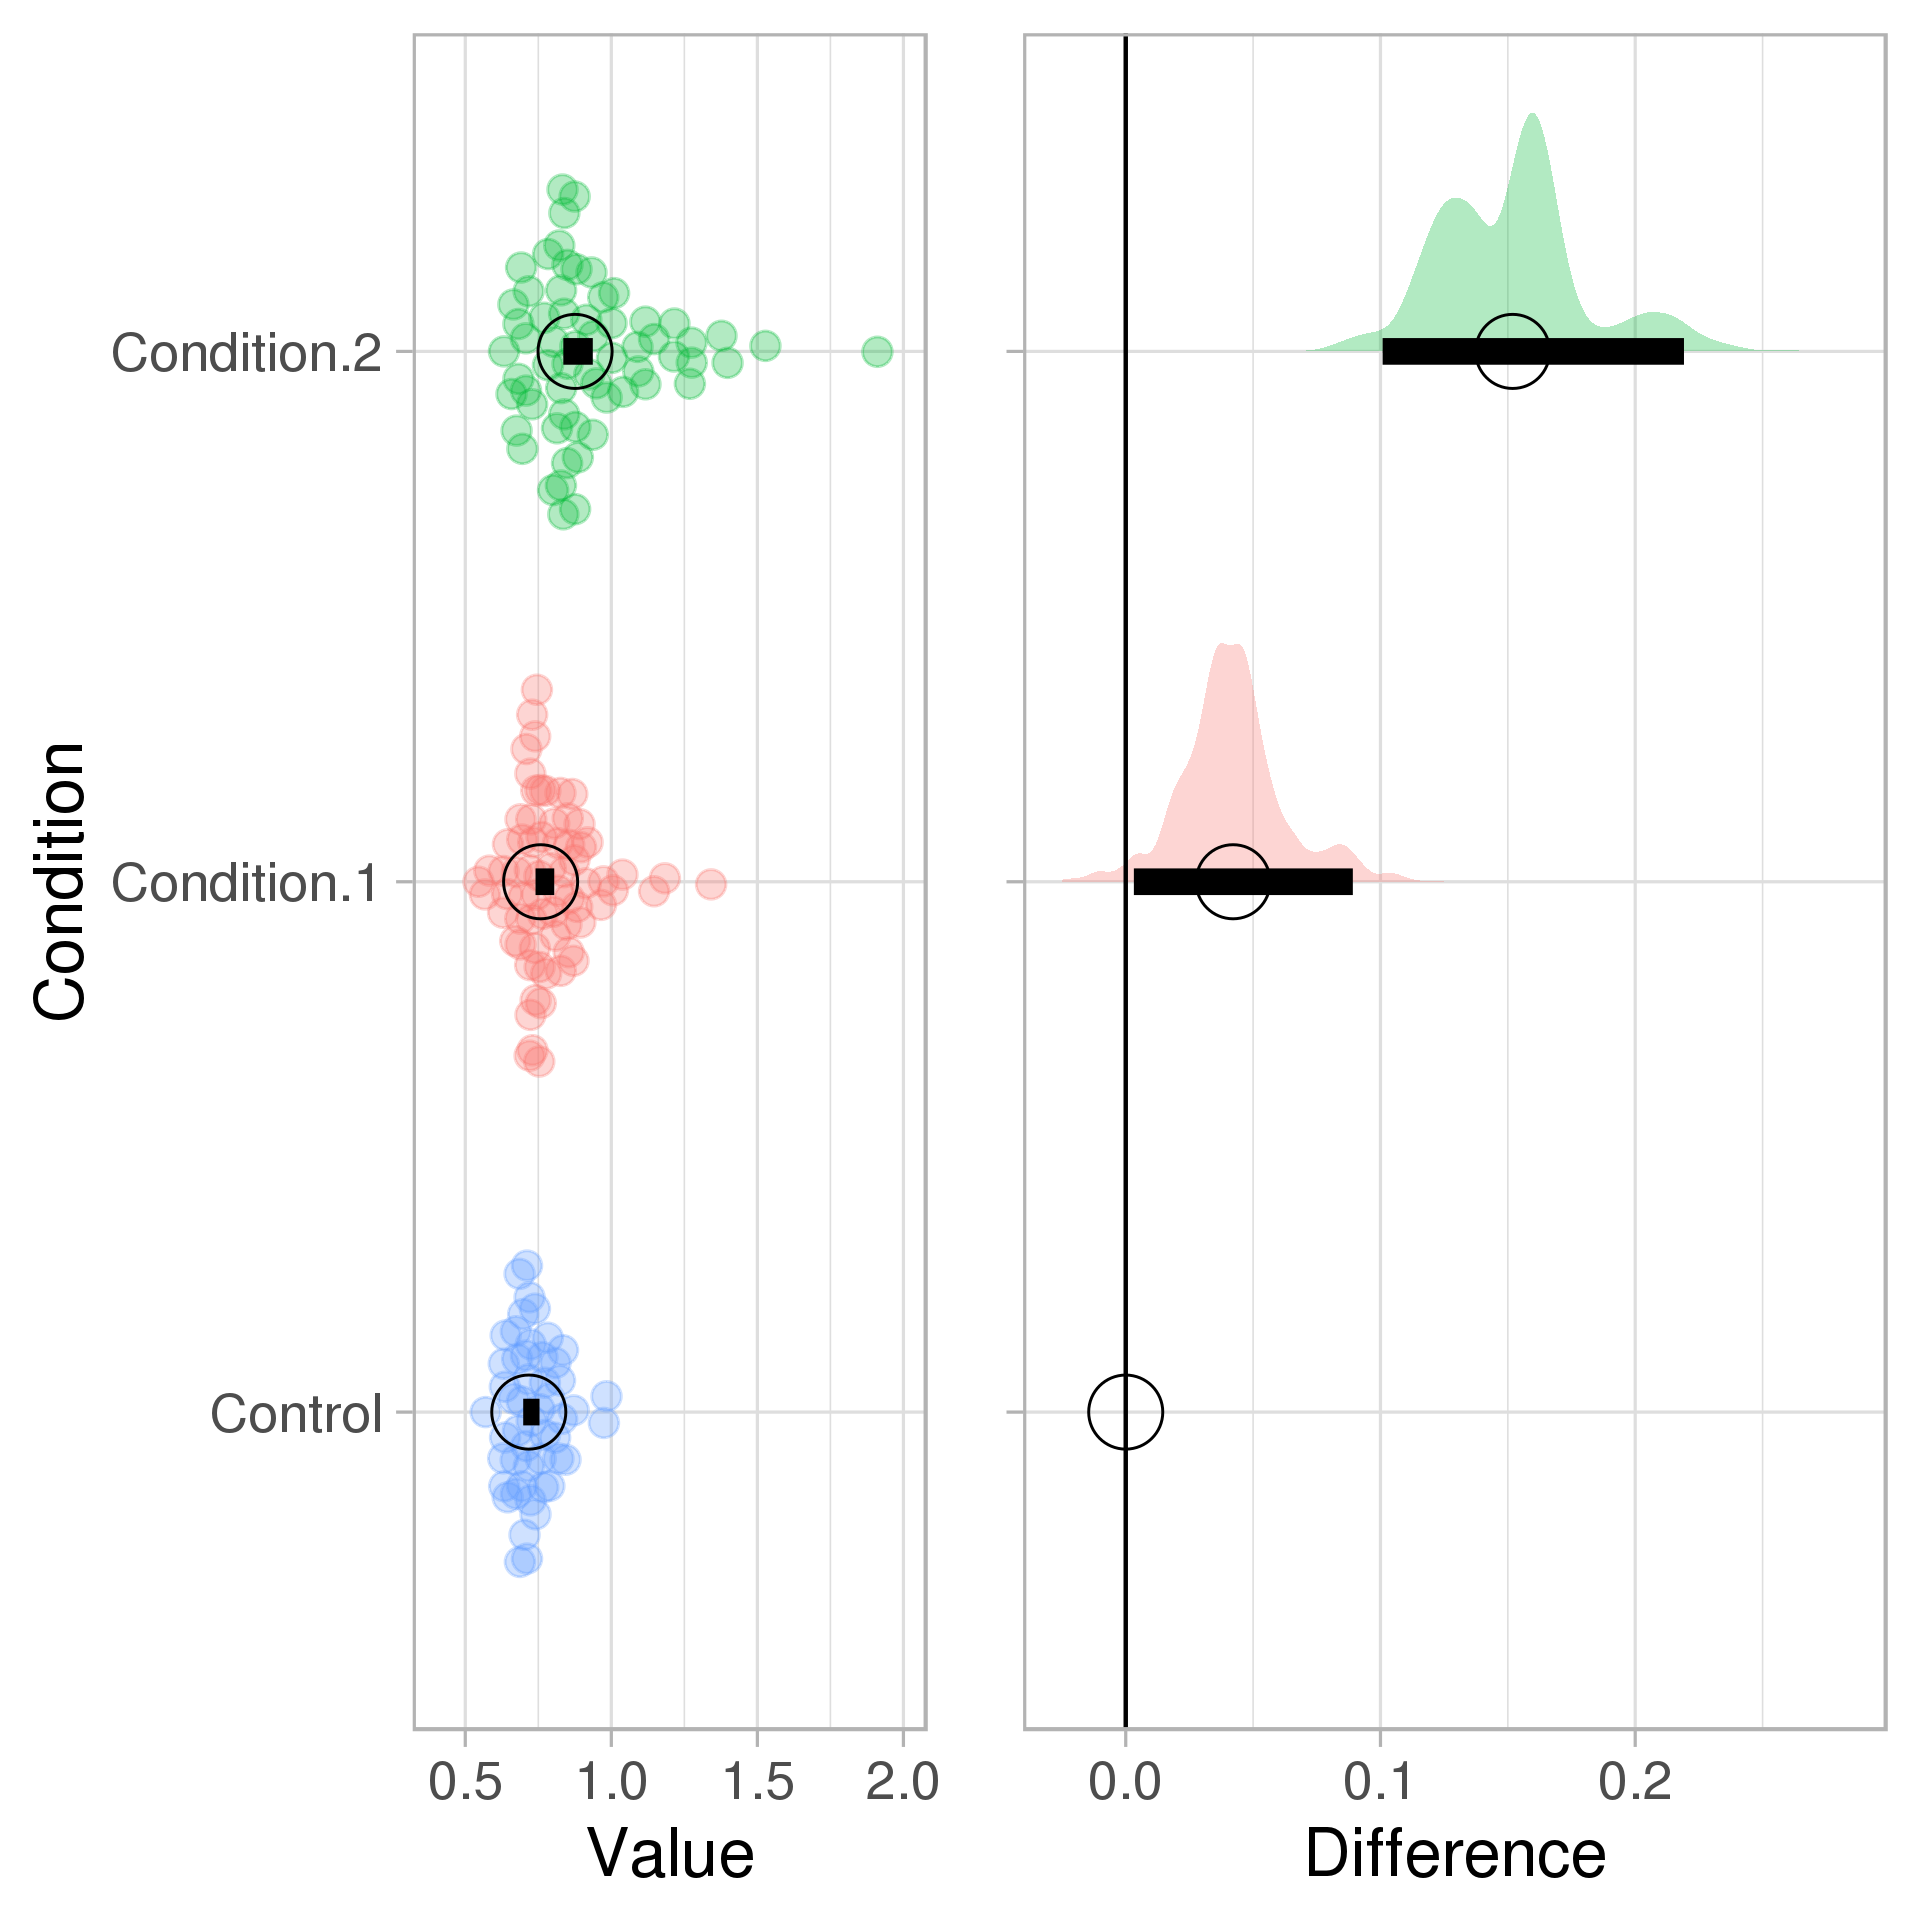
PlotsOfDifferences is an extension of PlotsOfData that plots the differences between the mean or median of (several) conditions and the mean or median of a selected reference condition. The difference is a type of effect size and has some advantages over null-hypothesis tests for comparison of samples, see this blog
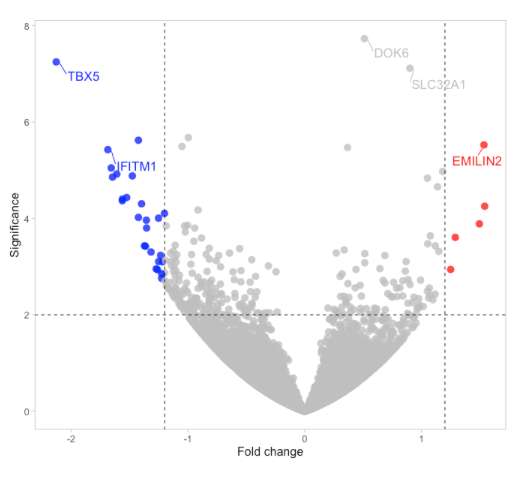
VolcaNoseR is a Shiny app for generating and nosing around volcano plots. The app allows user-defined cut-offs for the fold-change and significance. Lists with top candidates are shown and these can be annotated in the plot. In addition, user-selected candidates can be added as labels to the plot.
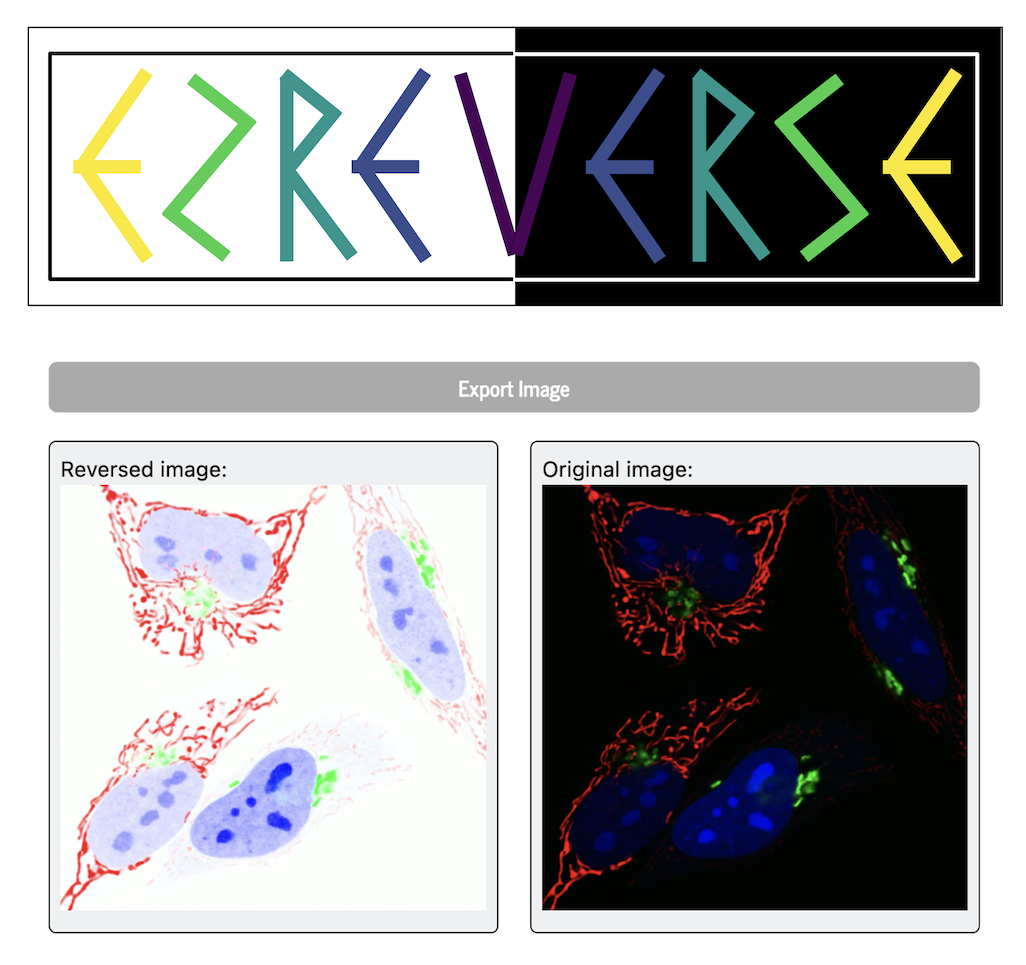
ezReverse is a Shiny app for inverting images. The main purpose is to have a rapid, user-friendly way to invert imags and thereby modify the image to fit on either a white background (for printing) or black background (for slides). Two methods are implemented for inversion of full-color fluorescence images, plots, schemes or any other image.
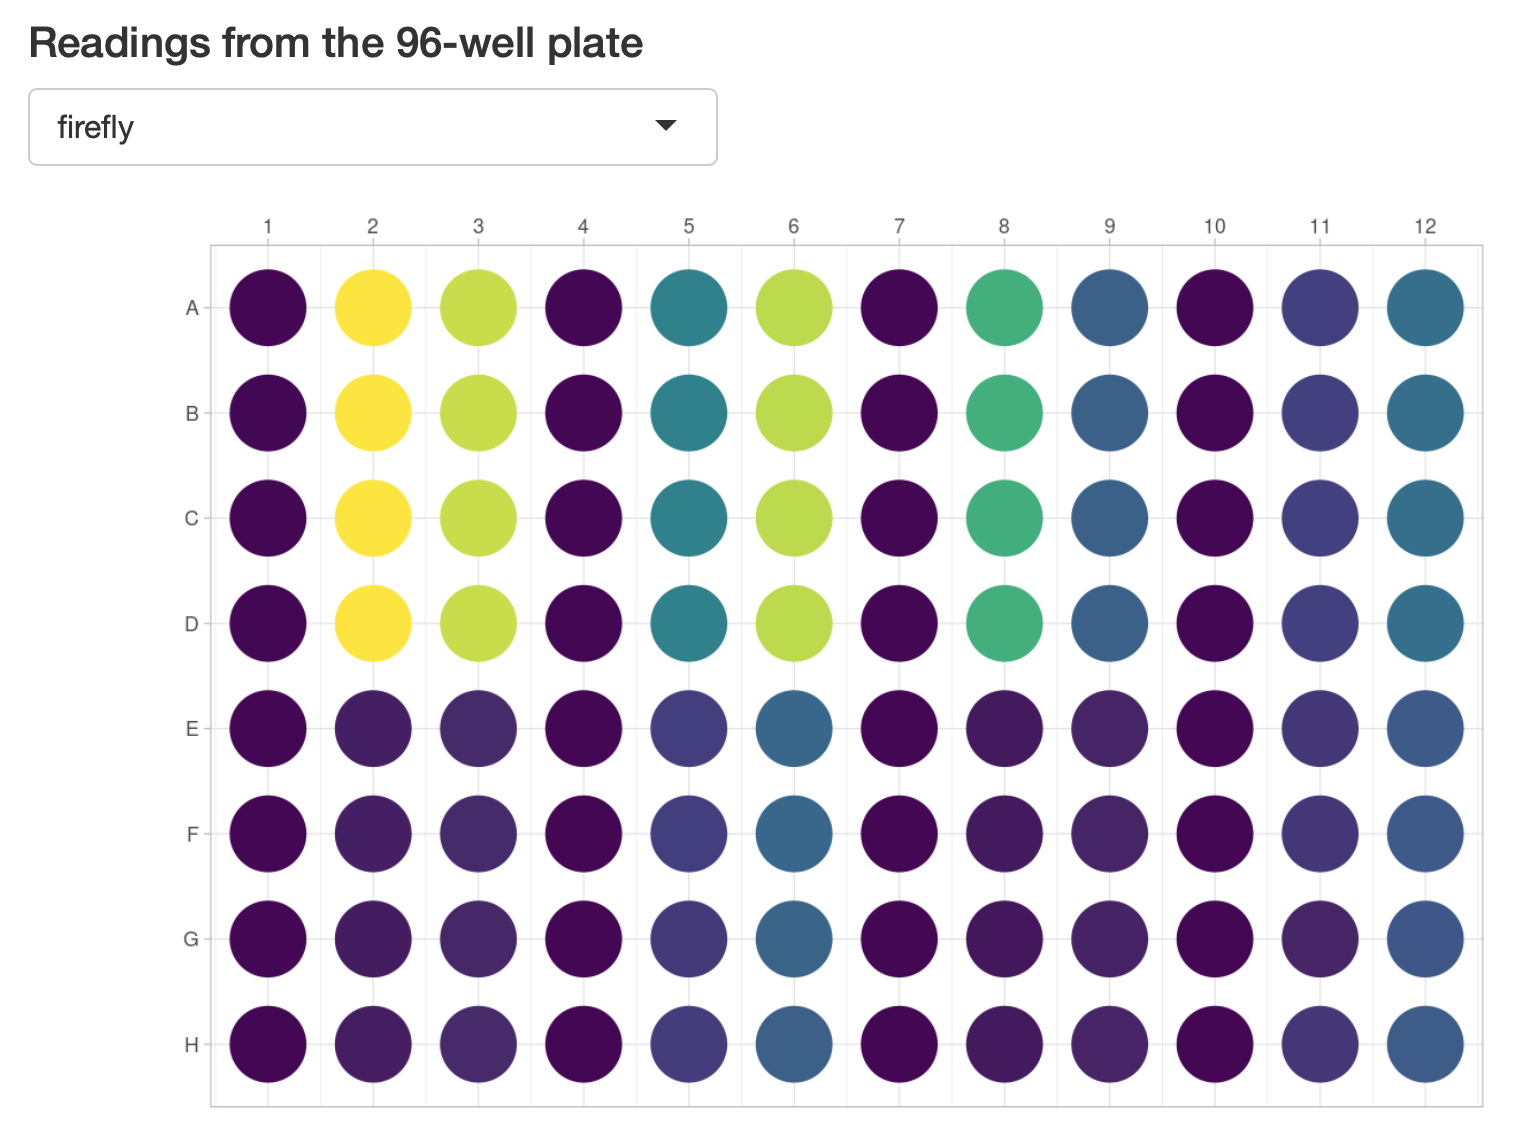
PlotXpress is a Shiny app for processing and visualizing data from from dual-luciferase expression assays. The app accepts data from the Promega GloMax reader. It uses the renilla signal for normalization of expression data and plots the relative expression grouped per condition and for different treatments.
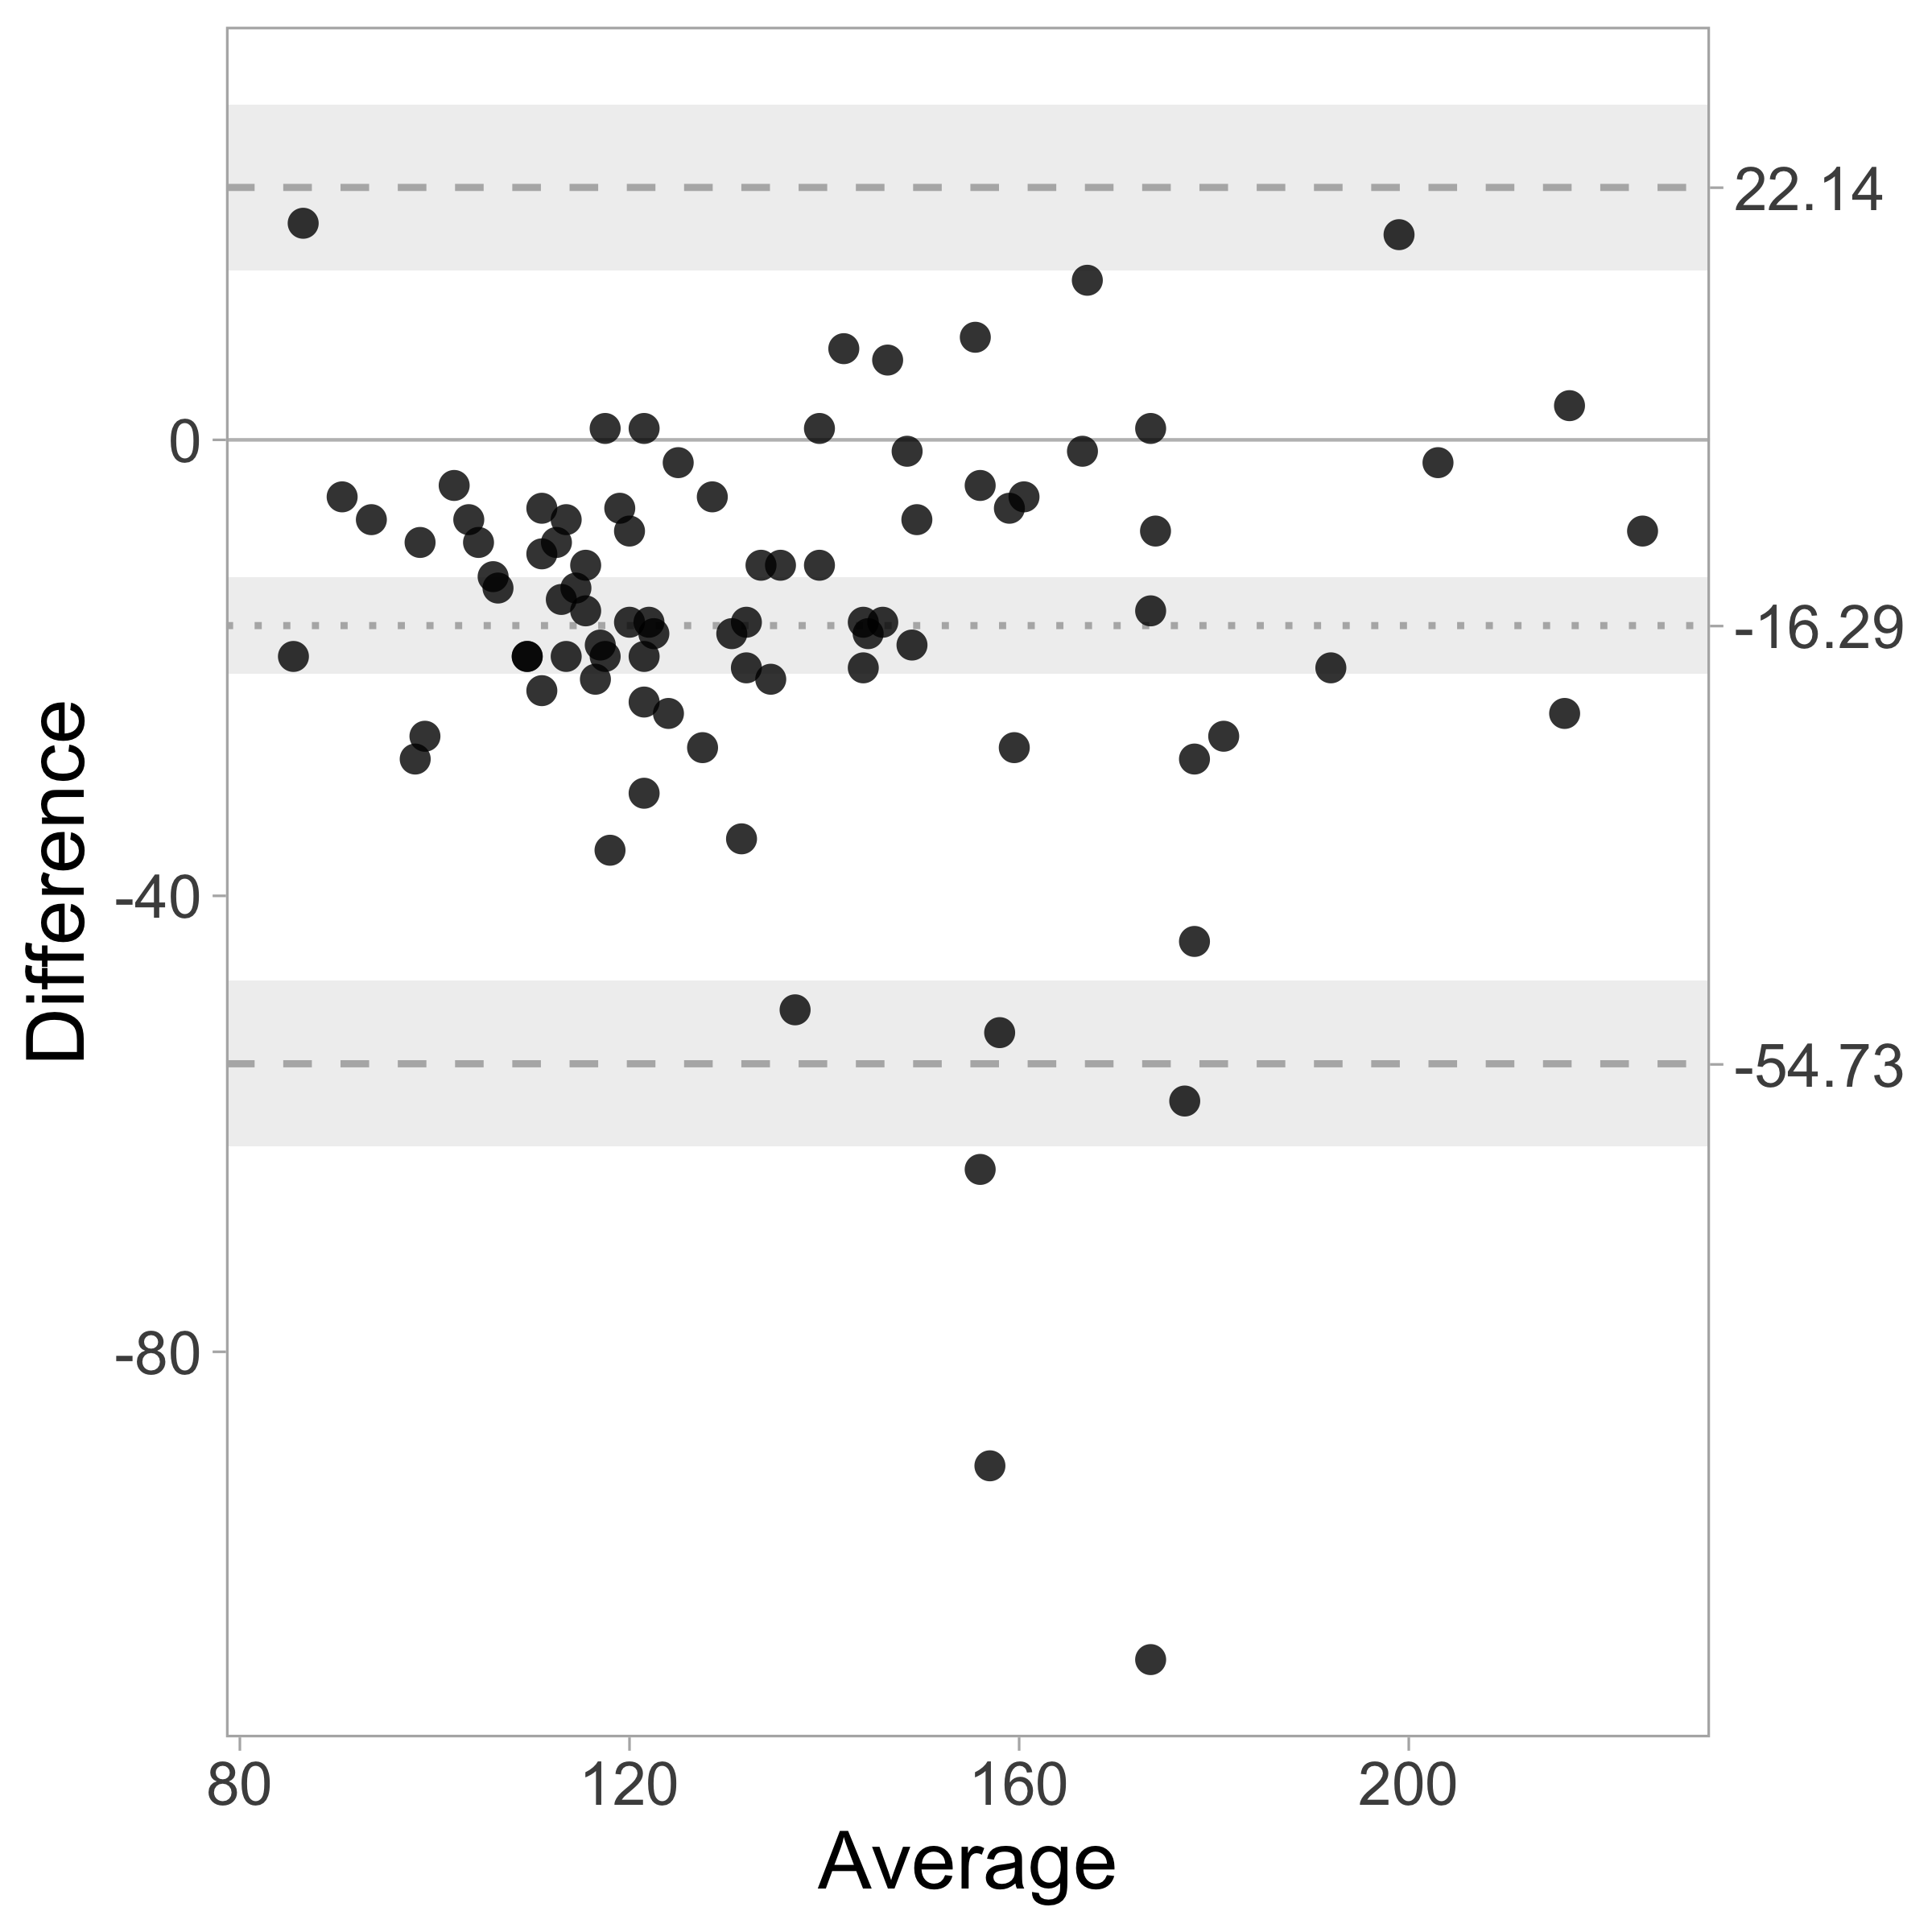
BA-plotteR is a Shiny app for generating Bland-Altman plots. These plots are used to evaluate the quantitative difference between measurements. The input is paired data from repeated measurements. When two different methods are used for measurements on the same subject, the Bland&Altman plot is a useful way of depicting their differences (bias).
General Information
The web-based tools were developed to facilitate data visualization and are broadly applicable. Use of the applications should be intuitive and straightforward with the example data that is included. You can use your own data via upload (csv or excel format) or by copy-paste. Note: We have no means of reading or storing your data. For full security the apps can be stored and operated locally. In order to use these tools offline/locally, you can get the code from GitHub and run the shiny apps from Rstudio. Sharing your plots/experiences via Bluesky (or e-mail) is appreciated. Should you have any questions, feature requests or feedback please contact me: E-mail: j.goedhart@uva.nl Bluesky: @joachimgoedhart.bsky.social The latest version of the Shiny apps is available on GitHub